Groups
This is a field you can use to combine dimension members into higher level categories. You can group a dimension that contains states, into regions. Groups are marked with a paper clip icon in the Data pane.
For example, let’s group States into two groups – West and Other – on a map.
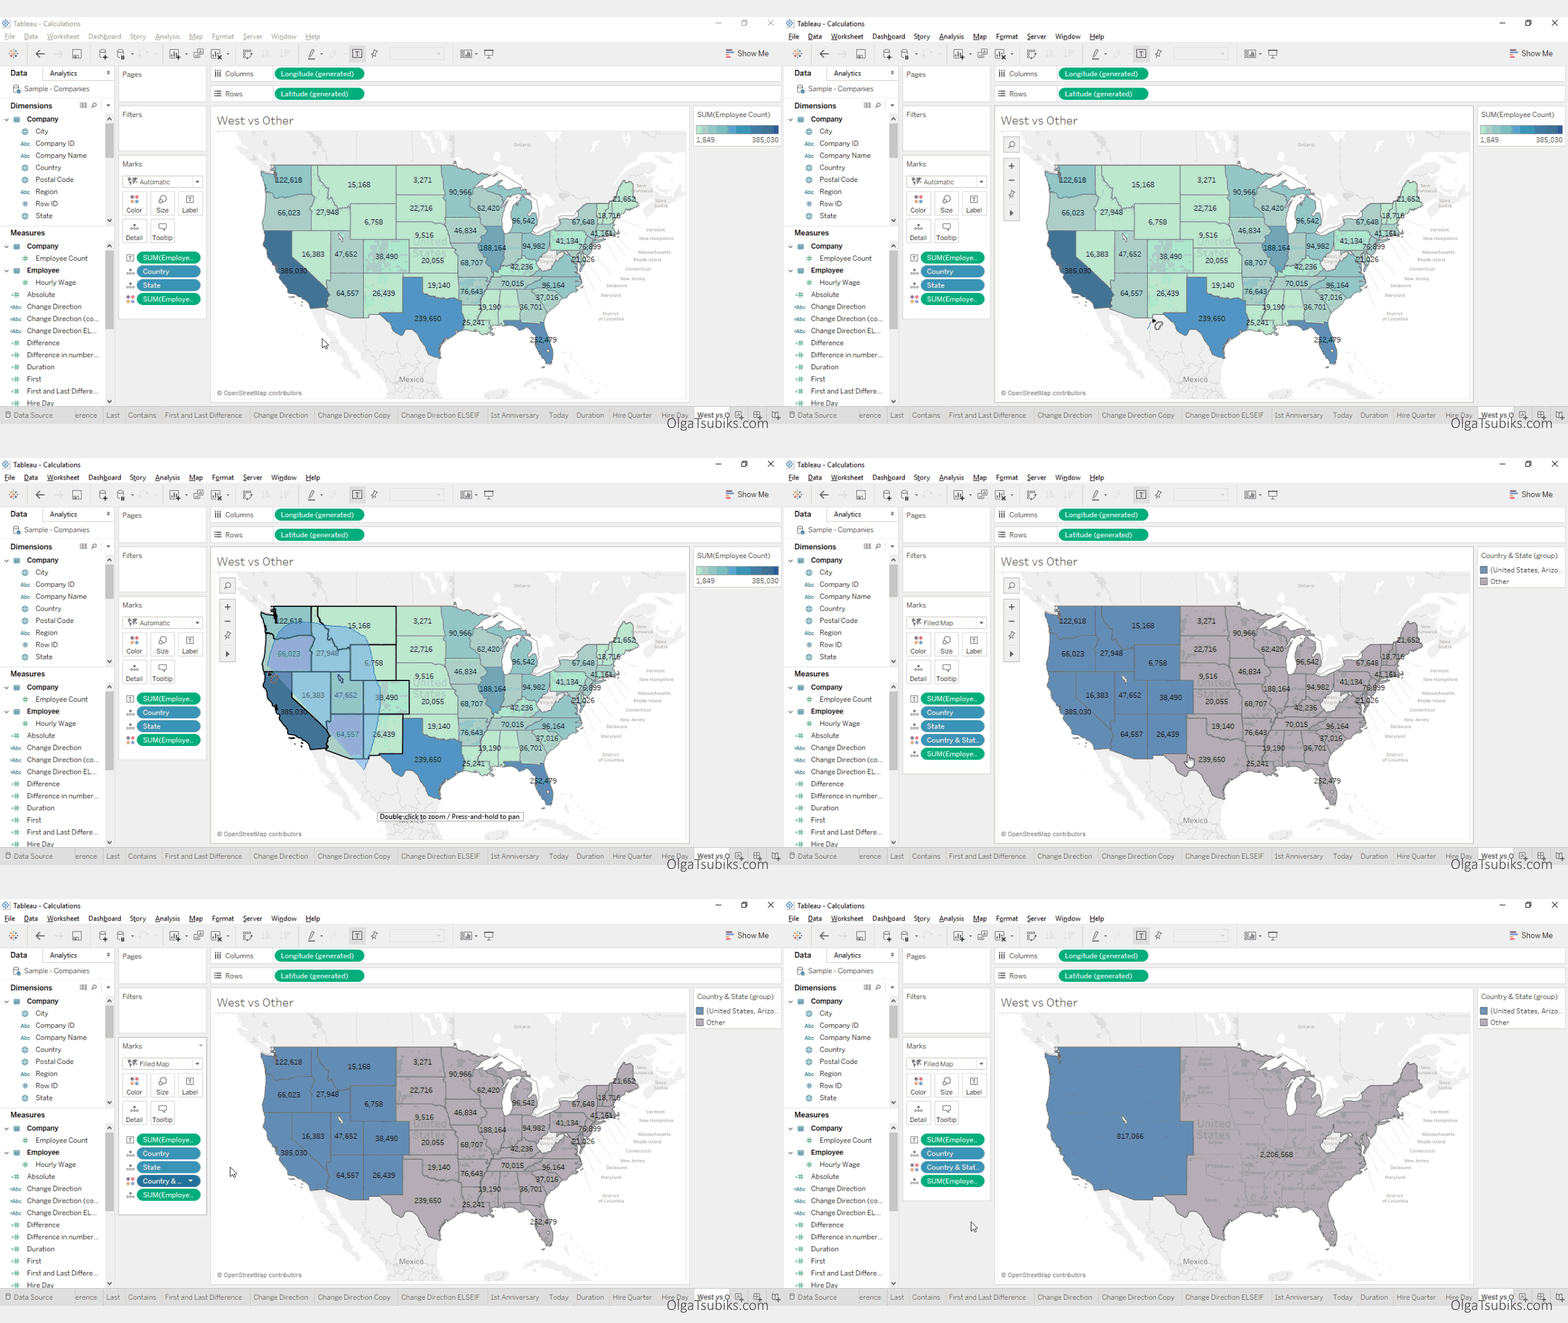
Solution: Select Lasso and grab Western states into a circle. Right-click and select Group Members (Paper Clip) on the tooltip.
Alternatively, you can hold CTRL or the Shift key to select each State by clicking on it (Shift key on a Mac). Tableau will add the ‘State (grouped)’ dimension. Right-click on it, and select the ‘Include Other’ option in the menu.
Bins
Bin is a user-defined grouping of measures in the data source. It is possible to create bins with reference to a dimension, or numeric bins. For example, let’s bin Employee Count into bins of 1000 employees each.
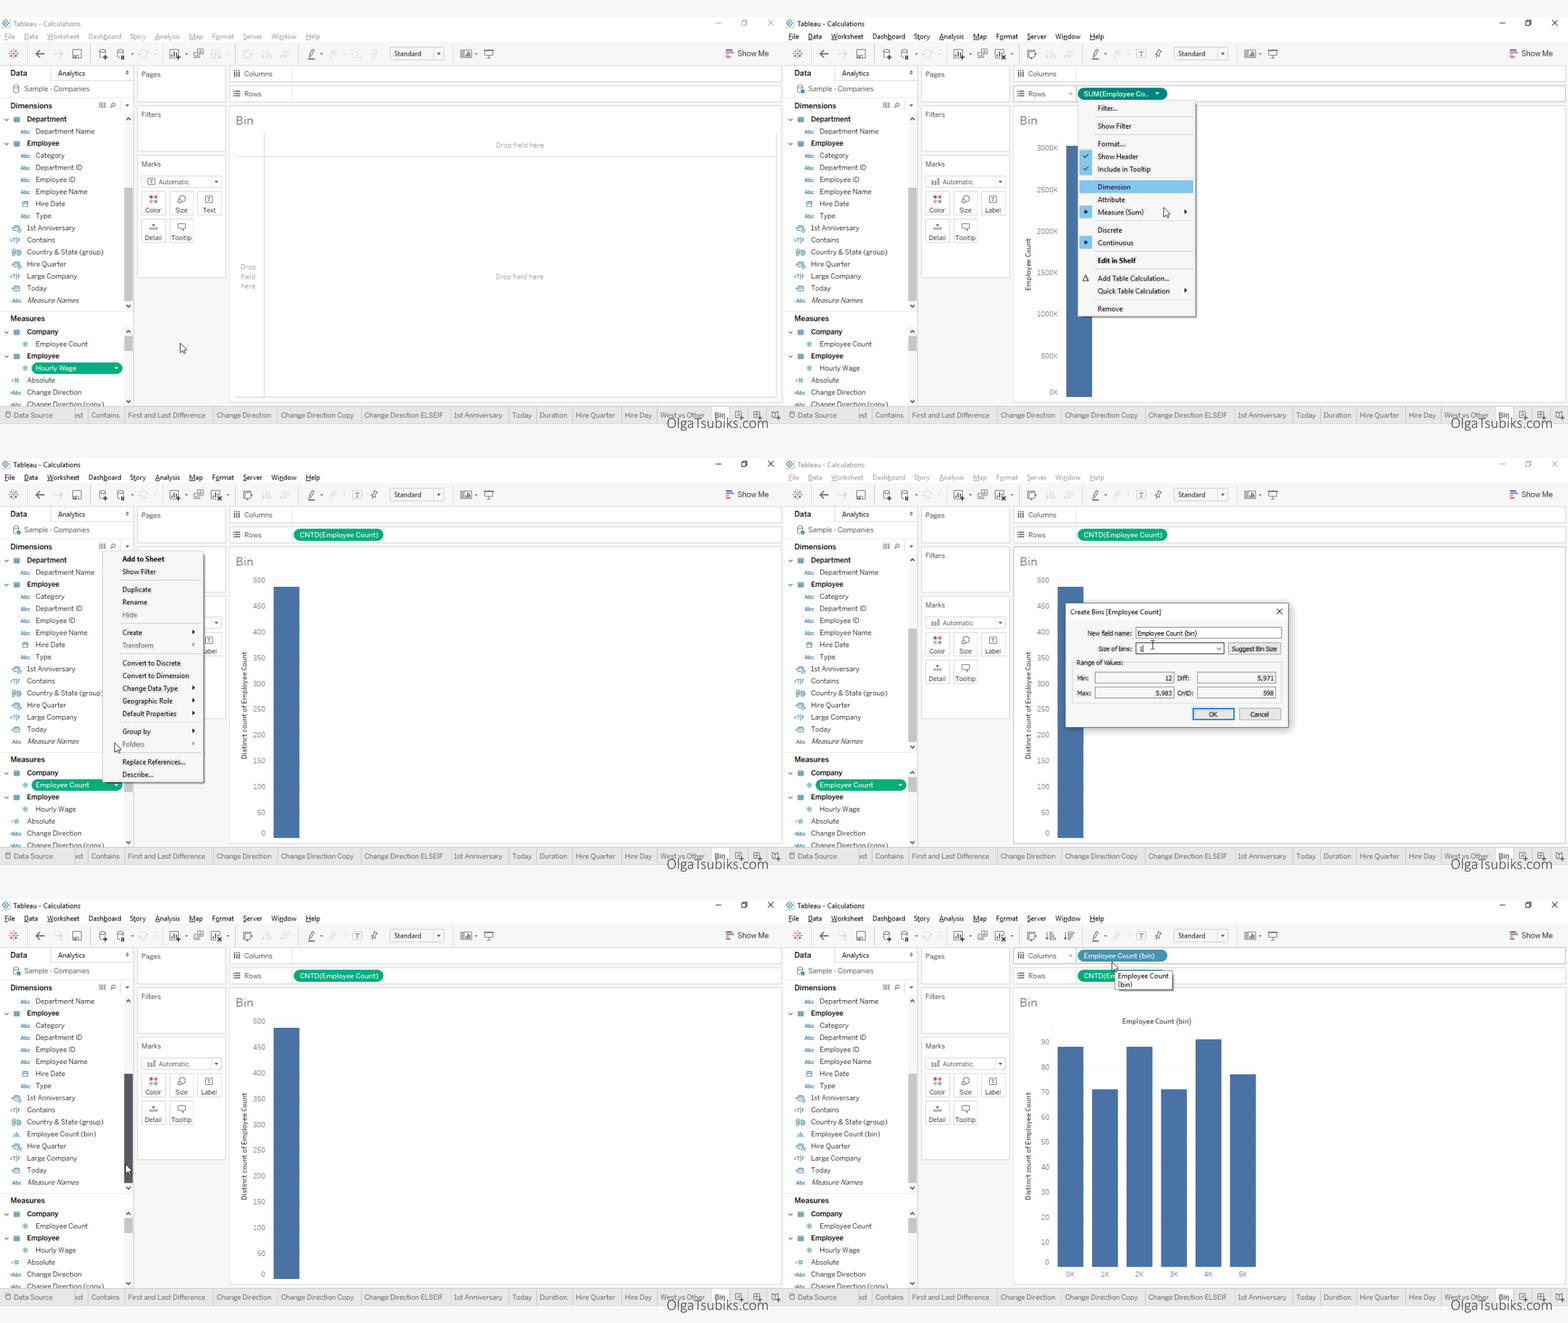
Solution:
Right-click on Employee Count and select Create > Bins. In the Create Bins window, specify the size of the bin by entering 1000 instead of the value Tableau has suggested. Click OK.
Hierarchies
Tableau allows you to create hierarchies. For example, it automatically converts a date into a hierarchy that includes years, quarters, months, etc. You can create hierarchies like this too. To drill down in hierarchy, click on the a + sign.
Let’s build a hierarchy that includes Company ID, Department ID, and Employee ID, and sort by Employee Count in ascending order.
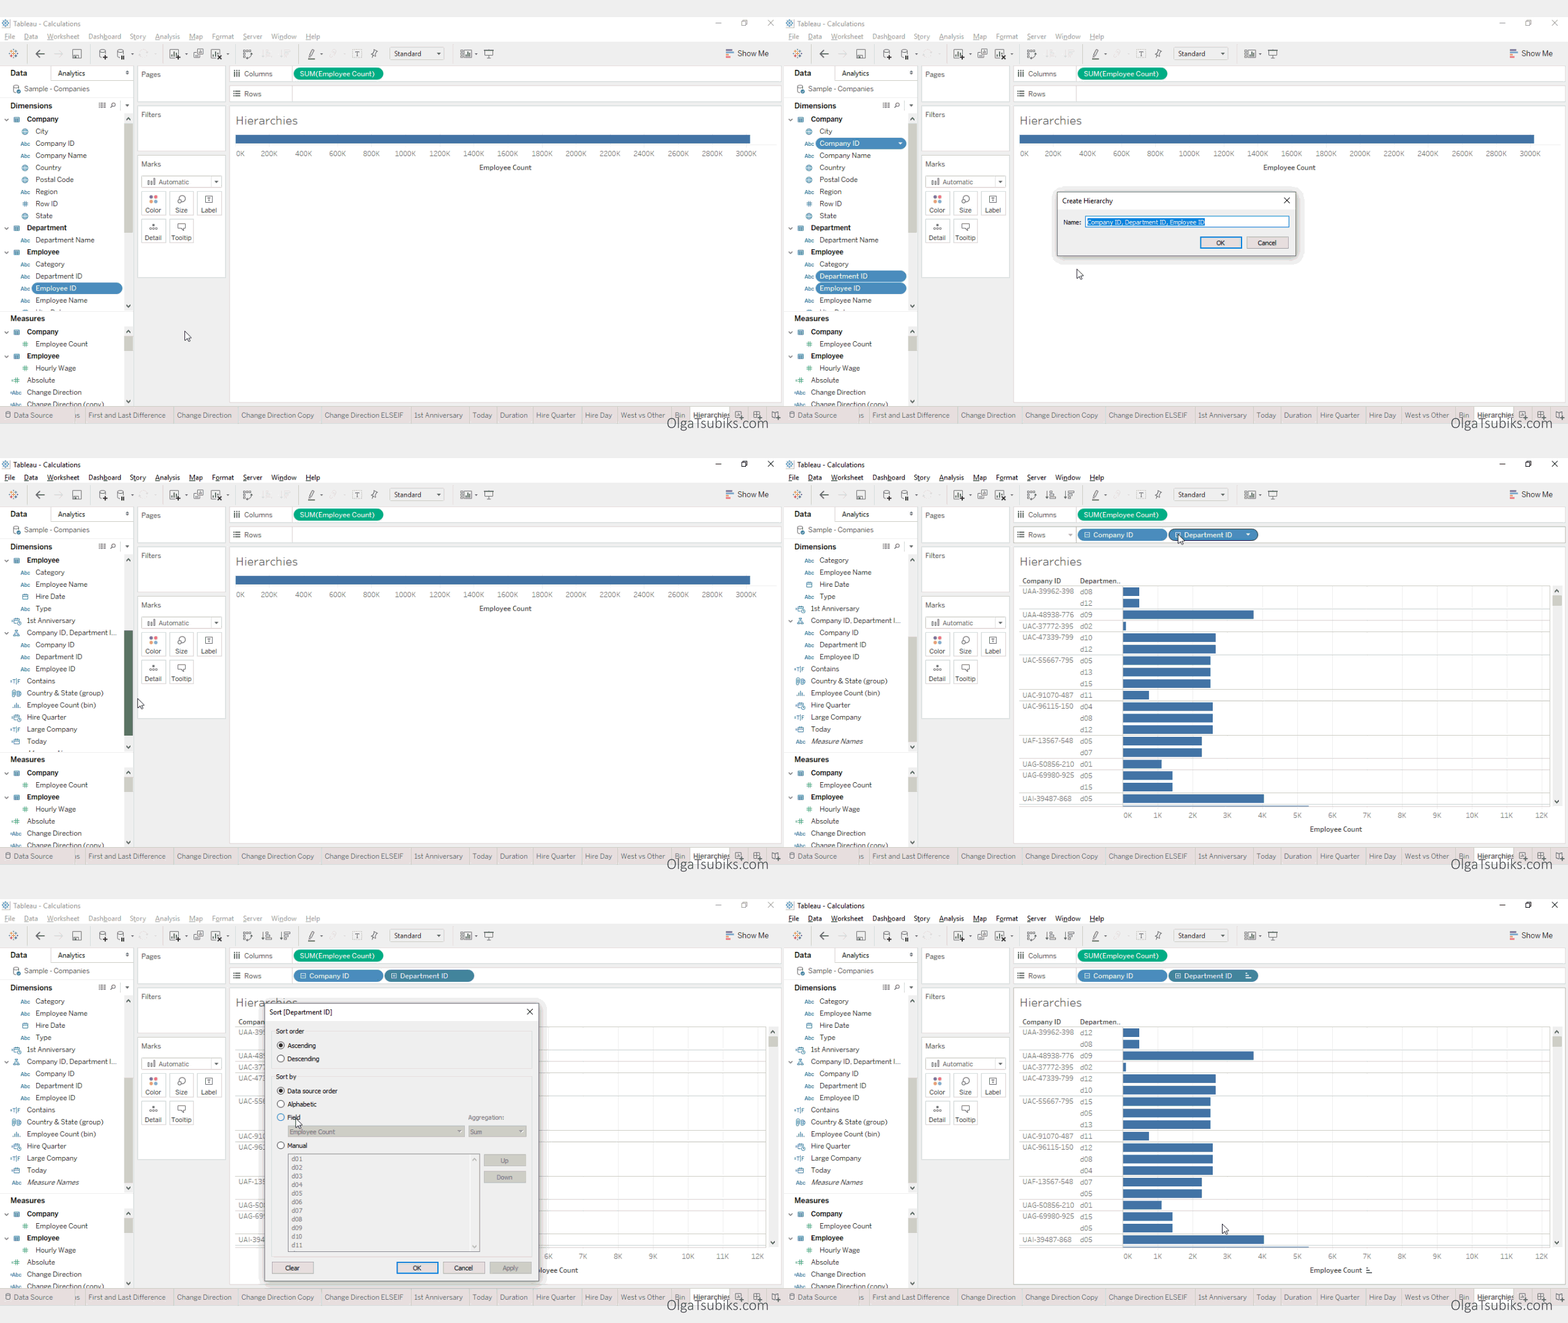
Solution: While holding CTRL or the Shift key, select Company ID > Department ID > Employee ID. Right-click and select Create > Hierarchy. Make sure to order the dimensions correctly. Place the hierarchy on the Rows Shelf and drill down to Department ID. Place sales on the Columns Shelf and click the Sort Ascending button on the toolbar.
Sorts
Tableau sorts data by arranging dimensions in a specified order. Each dimension that appears in the worksheet can be sorted independently of any other dimension.
Let’s sort the ‘Hire Date’ dimension and the ‘Department’ dimension to determine which departments and years have the highest number of employees.
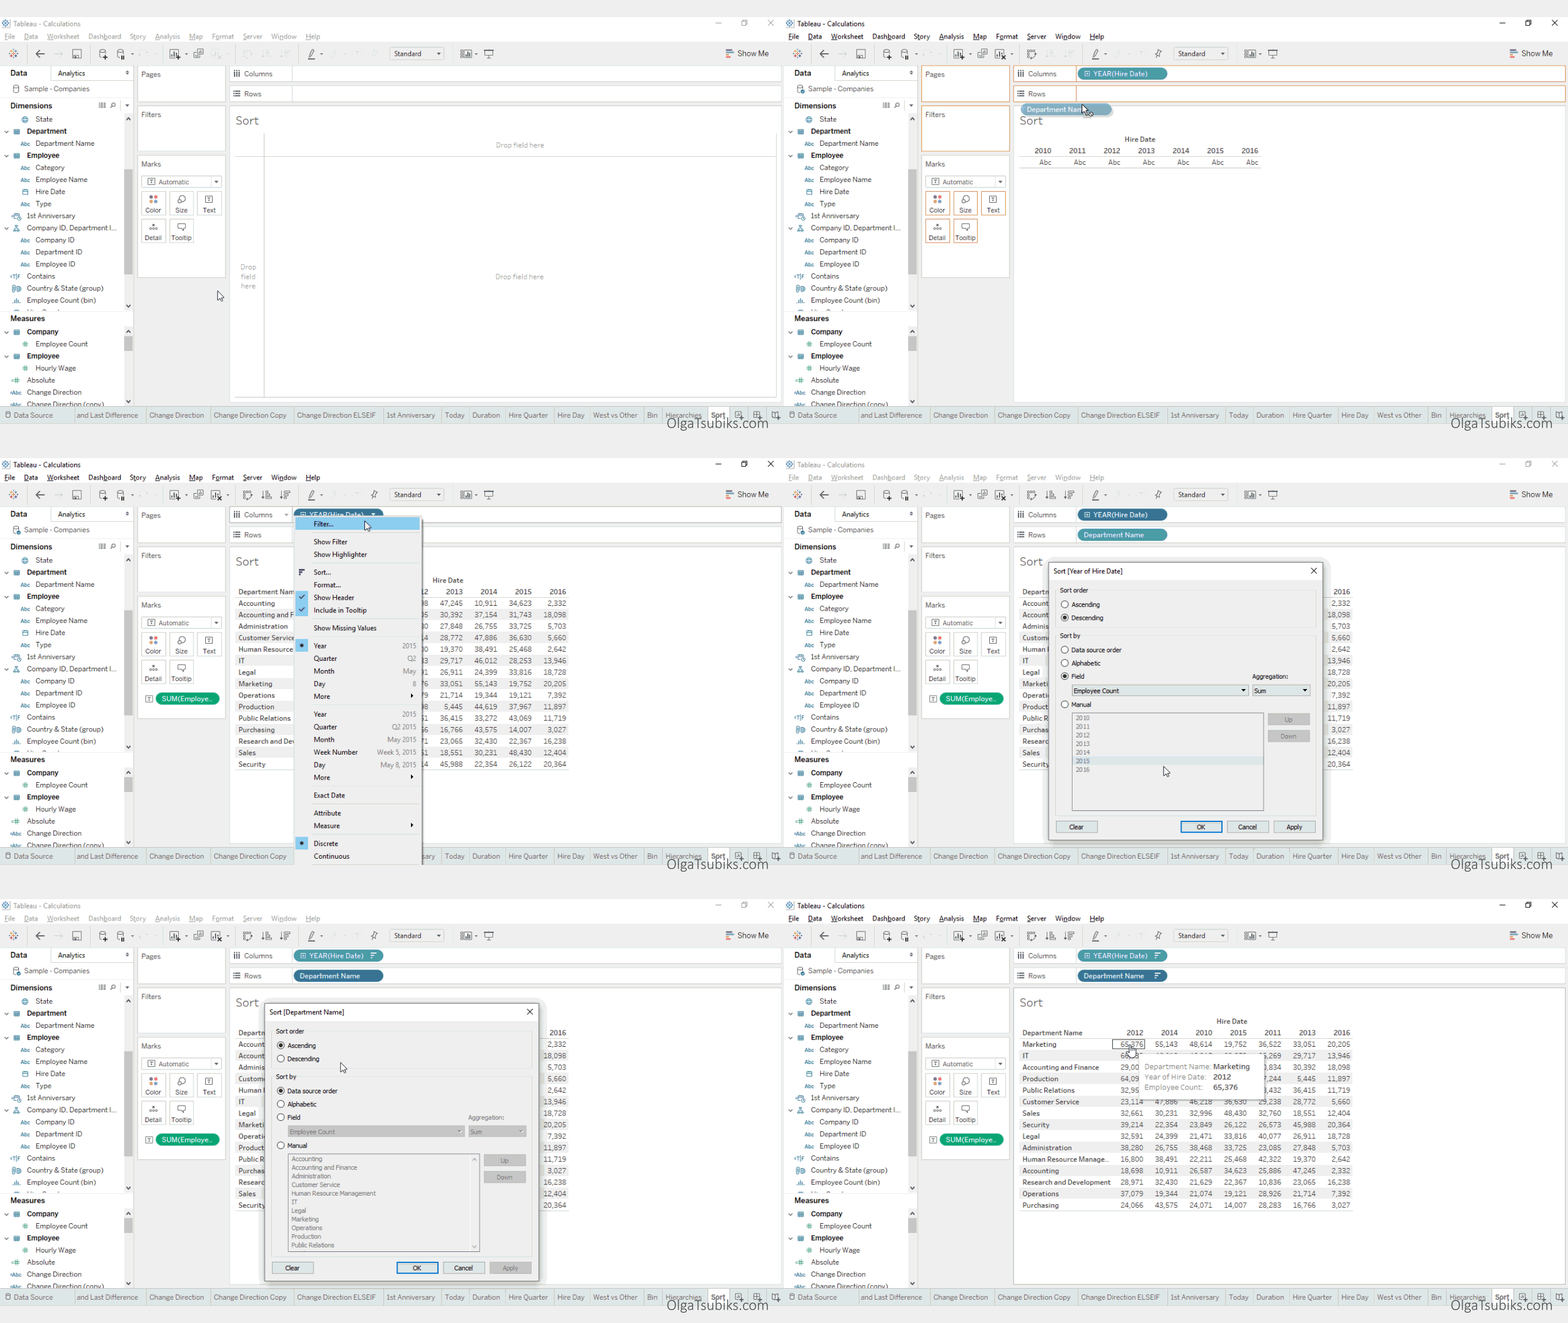
Solution: Place the Hire Date dimension on the Columns Shelf and the Department dimension on the Rows Shelf. Place Employee Count on the Text Marks Card. Right-click on Hire Date on the Columns and select Sort from the menu. Select Descending Sort order and sort by Employee Count (aggregation: sum). Click OK and apply the same to Department.
Filters
There are several ways to add filters to your view: placing a field on the Filters Shelf, selecting Exclude or Keep data points in the view, and showing interactive filters in the view. The easiest way to filter your data is by placing a field (dimension or measure) on the Filters Shelf.
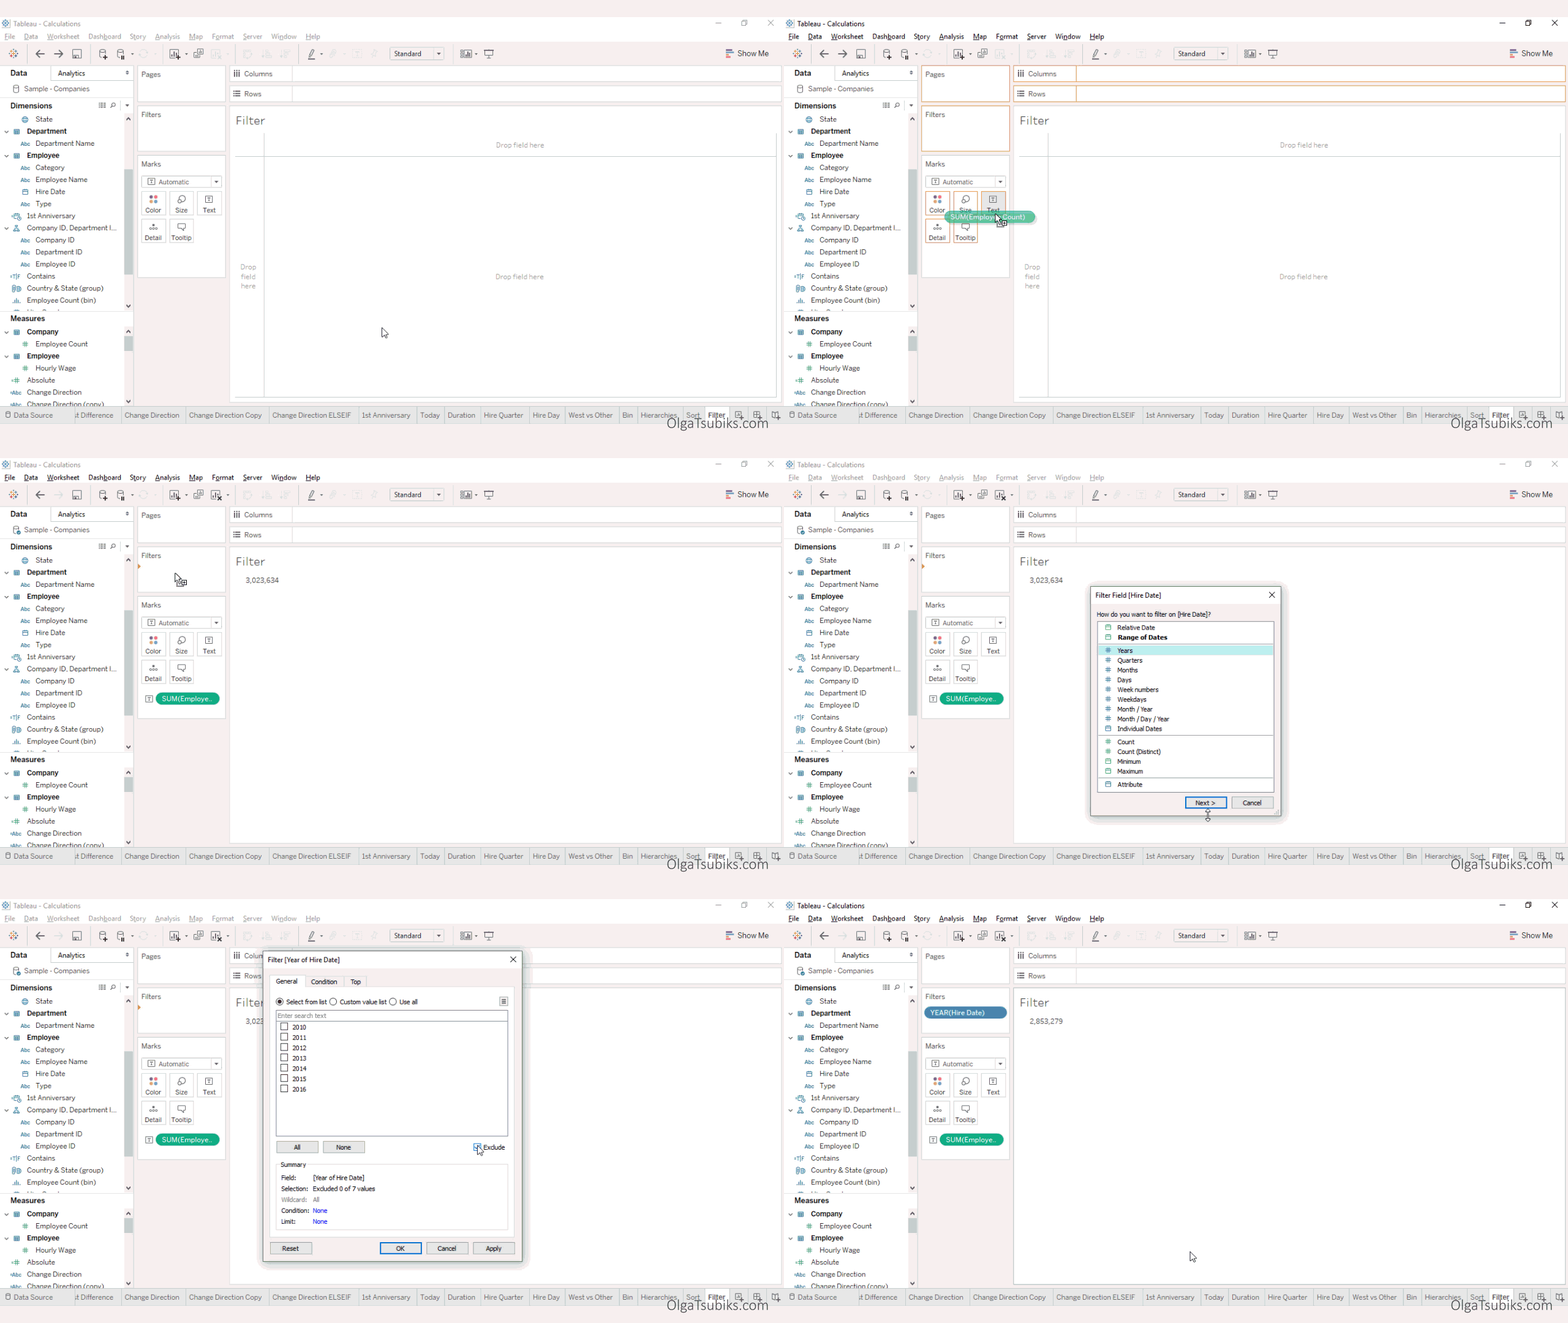
Let’s filter employees that were hired before 2016, and find the total number of employees hired by the end of 2015, in the dataset.
Solution:
Place the Employee Count dimension on the Text Marks Card. Place the Hire Date dimension on the Filters Shelf. Select Years and click the Next button. Select the latest date to be December 31 2015 and click OK.
2,853,279 employees were hired by the end of 2015.
This guide is part of the free Tableau training challenge. Take the challenge to prepare for your Tableau Certification
